New PROTECT publication

The article “Disentangling the drivers of future Antarctic ice loss with a historically calibrated ice-sheet model” was published.

It presents new projections of Antarctic ice sheet evolution to the end of the millennium, calibrated with observations.

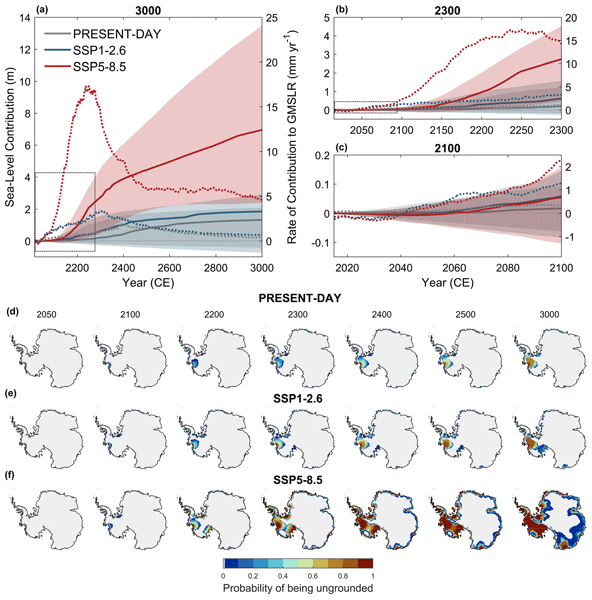
Our results highlight the dominant role of the ocean in driving Antarctic mass loss in the coming decades, leading to a substantial retreat in West Antarctica even with limited warming.

We also find that if regional Antarctic warming exceeds +7.5°C relative to today, the atmosphere will shift from a mitigating to an amplifying factor of mass loss as the increase in surface runoff outweighs the increase in snow accumulation.

Under a very high emissions scenario, this critical threshold could already be reached by the end of the century.

Such a combination of oceanic and atmospheric drivers would therefore lead to a complete collapse of the West Antarctic Ice Sheet and mass loss in East Antarctica, resulting in significant sea-level rise over the coming centuries.

In contrast, adopting sustainable practices would mitigate Antarctic mass loss and confine it mainly to the Amundsen Sea Embayment.

Calibrated probabilistic projections of the evolution of the Antarctic ice sheet (AIS) until the end of the millennium. Evolution of the AIS contribution to global mean sea-level rise (calculated as in Goelzer et al.2020) projected by the calibrated ensemble under constant present-day conditions and Shared Socioeconomic Pathway (SSP) 1-2.6 and SSP5-8.5 until 3000 (a), with a focus on the period 2015–2300 (b) and this century (c). Solid lines and shaded regions show the medians and 5 %–95 % probability intervals (N=100 per SSP scenario), with 5-year running average applied. Dashed lines show the median rate of contribution to global mean sea-level rise. Panels (d)(f) represent the probability of being ungrounded under constant present-day climate conditions (d), SSP1-2.6 (e), and SSP5-8.5 (f) at different points in time throughout the millennium. For each scenario, the marginal probability of being ungrounded at a given point is computed using the Bayesian-calibrated mean of the ensemble (N=100). Grey regions correspond to locations where there is a 0 % probability of being ungrounded. Present-day grounding lines are shown in black.

Be the first to comment

Leave a Reply

Your email address will not be published.


*